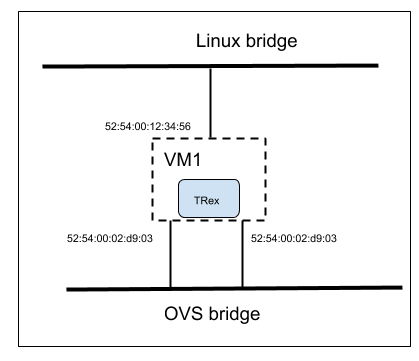
OVS DPDK performance evaluation Setup:
Nmap and sfr_delay_10_1g from trex was used to generate a traffic that creates around 200k active flows.
Nmap test: nmap -p- 7.7.7.101-200
Env for nmap

Trex sfr test: t-rex-64 -f avl/sfr_delay_10_1g.yaml -c 1 -m 10 -d 100 -p
Config:
– port_limit : 2
version : 2
#List of interfaces. Change to suit your setup. Use ./dpdk_setup_ports.py -s to see available options
interfaces : [“00:02.0″,”00:03.0”]
port_info : # set eh mac addr
– dest_mac : [0x52,0x54,0x00,0x02,0xd9,0x04] # port 0
src_mac : [0x52,0x54,0x00,0x02,0xd9,0x03]
– dest_mac : [0x52,0x54,0x00,0x02,0xd9,0x03] # port 1
src_mac : [0x52,0x54,0x00,0x02,0xd9,0x04]
Env for trex
Flow patterns with varying EMC and Megaflow configuration:
Running tests with different probability of insertion to EMC and with megaflow enabled/disable, might help in measuring the performance of upcalls, revalidators, flow expiration.
After running the above two tests with megaflow disable/enabled and different EMC value it was observed that, megaflow need to be disabled to create more active flows.
It was not possible to obtain 200k active flows with above two tests when megaflow is enabled.For example with megaflow enabled maximum flow that was generated was 104
flows : (current 0) (avg 0) (max 104)
pmd thread numa_id 0 core_id 0:
emc hits:8
megaflow hits:13107353
avg. subtable lookups per hit:1.01
miss:143
but with megaflow disabled the maximum flow obtained was 219271
flows : (current 0) (avg 0) (max 219271) (limit 200000)
pmd thread numa_id 0 core_id 0:
emc hits:9
megaflow hits:0
avg. subtable lookups per hit:0.00
miss:13107826
And the value of the probability of insertion to EMC does not seems to affect the number of flows while running tests.Number of flow generated around 200k for different values of emc-insert-inv-prob
emc-insert-inv-prob=100, the default value
lows : (current 0) (avg 0) (max 219271)
emc-insert-inv-prob=1, 100% probability of insertion to EMC
flows : (current 0) (avg 0) (max 208370) (limit 200000)
emc-insert-inv-prob=0, 0% probability of insertion to EMC, EMC disabled
flows : (current 0) (avg 0) (max 217570) (limit 200000)
Currently using ovs-dpdk-datapath-classifier-part-2 as reference for tracing and profiling the call graph for packet processing in OVS
Up to 15% of cycles spent in revalidate, with megaflow disables
| + 7.98% 0.00% urcu1 ovs-vswitchd [.] ovsthread_wrapper ▒
+ 7.98% 0.00% urcu1 libpthread-2.23.so [.] start_thread ▒ + 7.98% 0.00% urcu1 libc-2.23.so [.] __clone ▒ + 7.98% 0.08% urcu1 ovs-vswitchd [.] ovsrcu_postpone_thread ▒ 6.80% 6.80% revalidator12 ovs-vswitchd [.] revalidate.isra.19 |
Below is extended test results of the test cases with megaflow enabled/disabled and different emc-insert-inv-prob value.
| Emc-insert probability | megaflow | Emc hits | Megaflow hits | miss | |
| OVS 2.6 – nmap | Default | Enabled | 8 | 13107353 | 143 |
| OVS 2.6 – trex | Default | Enabled | 13592393 | 7924727 | 5 |
| OVS 2.6 – nmap | Default | Disabled | 9 | 0 | 13107826 |
| OVS 2.6 – trex | Default | Disabled | 67540150 | 119919463 | 27677119 |
| OVS 2.6 – nmap | 1 | Disabled | 22 | 0 | 13107705 |
| OVS 2.6 – nmap | 0 | Disabled | 8 | 0 | 13108184 |
| OVS (latest) – nmap | 0 | Enabled | 0 | 13107361 | 146 |
| OVS (latest) – nmap | 1 | Enabled | 25 | 13107476 | 155 |
nmap with megaflow enabled and default emc-insert-inv-prob
pmd thread numa_id 0 core_id 0:
emc hits:8
megaflow hits:13107353
avg. subtable lookups per hit:1.01
miss:143
lost:0
polling cycles:224722269058 (87.28%)
processing cycles:32742614492 (12.72%)
avg cycles per packet: 9781.99 (257464883550/26320306)
avg processing cycles per packet: 1244.01 (32742614492/26320306)
trex with megaflow enabled and default emc-insert-inv-prob
pmd thread numa_id 0 core_id 0:
emc hits:13592393
megaflow hits:7924727
avg. subtable lookups per hit:1.00
miss:5
lost:0
polling cycles:444135983951 (96.67%)
processing cycles:15289810525 (3.33%)
avg cycles per packet: 15596.58 (459425794476/29456829)
avg processing cycles per packet: 519.06 (15289810525/29456829)
nmap with megaflow disabled and default emc-insert-inv-prob
netdev@ovs-netdev:
flows : (current 0) (avg 0) (max 219271) (limit 200000)
dump duration : 1ms
ufid enabled : true
7: (keys 0)
pmd thread numa_id 0 core_id 0:
emc hits:9
megaflow hits:0
avg. subtable lookups per hit:0.00
miss:13107826
lost:0
polling cycles:494746899819 (73.38%)
processing cycles:179503783259 (26.62%)
avg cycles per packet: 51438.75 (674250683078/13107835)
avg processing cycles per packet: 13694.39 (179503783259/13107835)
trex with megaflow disabled and default emc-insert-inv-prob
netdev@ovs-netdev:
flows : (current 0) (avg 0) (max 209715) (limit 200000)
dump duration : 1ms
ufid enabled : true
7: (keys 0)
pmd thread numa_id 0 core_id 0:
emc hits:67540150
megaflow hits:119919463
avg. subtable lookups per hit:1.42
miss:27677119
lost:0
polling cycles:604568670107 (29.01%)
processing cycles:1479751125672 (70.99%)
avg cycles per packet: 5401.76 (2084319795779/385859589)
avg processing cycles per packet: 3834.95 (1479751125672/385859589)
nmap with megaflow disabled and emc-insert-inv-prob 1
[root@localhost openvswitch-2.6.1]# ./utilities/ovs-appctl upcall/show
netdev@ovs-netdev:
flows : (current 0) (avg 0) (max 208370) (limit 200000)
dump duration : 1ms
ufid enabled : true
6: (keys 0)
[root@localhost openvswitch-2.6.1]# ./utilities/ovs-appctl dpctl/dump-flows netdev@ovs-netdev
[root@localhost openvswitch-2.6.1]# ./utilities/ovs-appctl dpif-netdev/pmd-stats-show
pmd thread numa_id 0 core_id 0:
emc hits:22
megaflow hits:0
avg. subtable lookups per hit:0.00
miss:13107705
lost:0
polling cycles:476162914613 (73.36%)
processing cycles:172889441682 (26.64%)
avg cycles per packet: 49516.77 (649052356295/13107727)
avg processing cycles per packet: 13189.89 (172889441682/13107727)
nmap with megaflow disabled and emc-insert-inv-prob 0
[root@localhost openvswitch-2.6.1]# ./utilities/ovs-appctl upcall/show
netdev@ovs-netdev:
flows : (current 0) (avg 0) (max 217570) (limit 200000)
dump duration : 1ms
ufid enabled : true
7: (keys 0)
pmd thread numa_id 0 core_id 0:
emc hits:8
megaflow hits:0
avg. subtable lookups per hit:0.00
miss:13108184
lost:0
polling cycles:168494002964 (48.21%)
processing cycles:181018583110 (51.79%)
avg cycles per packet: 26663.68 (349512586074/13108192)
avg processing cycles per packet: 13809.58 (181018583110/13108192)
nmap with patched ovs, megaflow enabled and emc-insert-inv-prob 0
pmd thread numa_id 0 core_id 0:
emc hits:0
megaflow hits:13107361
avg. subtable lookups per hit:1.02
miss:146
lost:0
polling cycles:140234173492 (68.20%)
processing cycles:65401982081 (31.80%)
avg cycles per packet: 7779.18 (205636155573/26434165)
avg processing cycles per packet: 2474.15 (65401982081/26434165)
nmap with patched ovs, megaflow enabled and emc-insert-inv-prob 1
flows : (current 0) (avg 0) (max 104) (limit 10000)
dump duration : 1ms
ufid enabled : true
6: (keys 0)
pmd thread numa_id 0 core_id 0:
emc hits:25
megaflow hits:13107476
avg. subtable lookups per hit:1.00
miss:155
lost:0
polling cycles:597268748462 (89.70%)
processing cycles:68602128353 (10.30%)
avg cycles per packet: 25362.44 (665870876815/26254210)
avg processing cycles per packet: 2613.00 (68602128353/26254210)
OVS call stack
dp_netdev_process_rxq_port
|
|– netdev_rxq_recv
|
|– dp_netdev_input
|
|– dp_netdev_input__
|
|–emc_processing ## emc miss causes fast_path_processing
|
| — fast_path_processing
|– dp_netdev_pmd_lookup_dpcls ## get classifier for the port
|– dpcls_lookup ### causes upcall when it fails to match in subtables
|
|– netdev_flow_key_hash_in_mask
|
|– handle_packet_upcall ##called with dpif_upcall_type type=DPIF_UC_MISS
|
|– dp_netdev_upcall
|
|– upcall_cb ofproto/ofproto-dpif-upcall.c
|
|– upcall_receive
|– process_upcall
|
|–classify_upcall## identfies the type of upcall MISS_UPCALL,SFLOW_UPCALL
|– upcall_xlate ### in case of MISS_UPCALL
|
|– ukey_create_from_upcall
|
|– flow_wildcards_init_for_packet ## Converts a flow into flow wildcards.
|– emc_probabilistic_insert #add to emc
|– emc_insert
Megaflow hit pattern
For a given flow rule evaluate creation and distribution of megaflow hits among the generated flows.
Traffic pattern:
Nmap was used as traffic generator, with nmap client VM IP set to 7.7.7.1 and nmap target vm set to range 7.7.7.101-200
Traffic generator command: Namp -p- 7.7.7.101-200 run on client
Scenarios considered for analyse,
- Default setup with no rules
- Behavior(flow generated and megaflow hits) when rules added to drop packets
- With varying distribution of ports
- Subset of rule with priority
- Overlapping negative rule with priority
Default setup with no rules:
Both tcp and udp use the same flow
For udp and tcp traffic flow created based on recirc_id(0),in_port(2),eth(src=52:54:00:02:d9:03,dst=52:54:00:02:d9:04),eth_type(0x0800),ipv4(frag=no), hence both tcp and udp match same flow.
With varying distribution of ports
Drop on a single port
priority=65535,tcp,tp_dst=90
NXST_FLOW reply (xid=0x4):
cookie=0x0, duration=310.612s, table=0, n_packets=200, n_bytes=11600, idle_age=223, priority=65535,tcp,tp_dst=90 actions=drop
cookie=0x0, duration=14784.512s, table=0, n_packets=131050450, n_bytes=7338758212, idle_age=211, priority=0 actions=NORMAL
pmd thread numa_id 0 core_id 0:
emc hits:0
megaflow hits:26215100
avg. subtable lookups per hit:2.02
miss:339
lost:0
polling cycles:1718918822602 (92.20%)
processing cycles:145365311077 (7.80%)
avg cycles per packet: 23565.15 (1864284133679/79111900)
avg processing cycles per packet: 1837.46 (145365311077/79111900)
Drop on multiple ports 90,91 (adjacent)
NXST_FLOW reply (xid=0x4):
cookie=0x0, duration=703.939s, table=0, n_packets=400, n_bytes=23200, idle_age=182, priority=65535,tcp,tp_dst=90 actions=drop
cookie=0x0, duration=262.234s, table=0, n_packets=200, n_bytes=11600, idle_age=187, priority=65535,tcp,tp_dst=91 actions=drop
cookie=0x0, duration=15177.839s, table=0, n_packets=144157608, n_bytes=8072752848, idle_age=169, priority=0 actions=NORMAL
pmd thread numa_id 0 core_id 0:
emc hits:0
megaflow hits:13107424
avg. subtable lookups per hit:1.55
miss:134
lost:0
polling cycles:456656331253 (87.01%)
processing cycles:68160626106 (12.99%)
avg cycles per packet: 15711.41 (524816957359/33403561)
avg processing cycles per packet: 2040.52 (68160626106/33403561)
Drop on multiple ports 22,5900 (random)
NXST_FLOW reply (xid=0x4):
cookie=0x0, duration=916.133s, table=0, n_packets=495, n_bytes=28710, idle_age=234, priority=65535,tcp,tp_dst=22 actions=drop
cookie=0x0, duration=908.148s, table=0, n_packets=495, n_bytes=28710, idle_age=234, priority=65535,tcp,tp_dst=5900 actions=drop
cookie=0x0, duration=1058.716s, table=0, n_packets=26214175, n_bytes=1467981542, idle_age=211, priority=0 actions=NORMAL
pmd thread numa_id 0 core_id 0:
emc hits:0
megaflow hits:13107248
avg. subtable lookups per hit:1.54
miss:148
lost:0
polling cycles:521231962931 (88.32%)
processing cycles:68939617774 (11.68%)
avg cycles per packet: 17742.96 (590171580705/33262300)
avg processing cycles per packet: 2072.61 (68939617774/33262300)
Drop on range of ports(using mask)
NXST_FLOW reply (xid=0x4):
cookie=0x0, duration=763.930s, table=0, n_packets=1632, n_bytes=94656, idle_age=638, priority=65535,tcp,tp_dst=0x58/0xfff8 actions=drop
cookie=0x0, duration=16429.639s, table=0, n_packets=170369811, n_bytes=9540625486, idle_age=638, priority=0 actions=NORMAL
pmd thread numa_id 0 core_id 0:
emc hits:0
megaflow hits:13107414
avg. subtable lookups per hit:1.52
miss:123
lost:0
polling cycles:1433383284938 (95.52%)
processing cycles:67299002441 (4.48%)
avg cycles per packet: 45368.62 (1500682287379/33077539)
avg processing cycles per packet: 2034.58 (67299002441/33077539)
Drop on range of ports (individual flows)
NXST_FLOW reply (xid=0x4):
cookie=0x0, duration=1071.015s, table=0, n_packets=600, n_bytes=34800, idle_age=231, priority=65535,tcp,tp_dst=90 actions=drop
cookie=0x0, duration=629.310s, table=0, n_packets=400, n_bytes=23200, idle_age=224, priority=65535,tcp,tp_dst=91 actions=drop
cookie=0x0, duration=332.275s, table=0, n_packets=200, n_bytes=11600, idle_age=227, priority=65535,tcp,tp_dst=92 actions=drop
cookie=0x0, duration=329.065s, table=0, n_packets=200, n_bytes=11600, idle_age=224, priority=65535,tcp,tp_dst=93 actions=drop
cookie=0x0, duration=325.884s, table=0, n_packets=200, n_bytes=11600, idle_age=232, priority=65535,tcp,tp_dst=94 actions=drop
cookie=0x0, duration=321.222s, table=0, n_packets=200, n_bytes=11600, idle_age=243, priority=65535,tcp,tp_dst=95 actions=drop
cookie=0x0, duration=15544.915s, table=0, n_packets=157263906, n_bytes=8806700164, idle_age=220, priority=0 actions=NORMAL
pmd thread numa_id 0 core_id 0:
emc hits:0
megaflow hits:13107353
avg. subtable lookups per hit:1.55
miss:145
lost:0
polling cycles:573051591938 (89.02%)
processing cycles:70647647633 (10.98%)
avg cycles per packet: 19288.41 (643699239571/33372334)
avg processing cycles per packet: 2116.95 (70647647633/33372334)
Observation:
Flow rule using mask has far fewer number of flows compared to equivalent rule based on individual flows.
Subset of rule with priority
Drop on IP and port with different priority rule
NXST_FLOW reply (xid=0x4):
cookie=0x0, duration=506.260s, table=0, n_packets=16, n_bytes=928, idle_age=436, priority=65535,tcp,nw_dst=7.7.7.104,tp_dst=0x58/0xfff8 actions=drop
cookie=0x0, duration=534.825s, table=0, n_packets=3488, n_bytes=202304, idle_age=343, priority=65534,tcp,tp_dst=0x50/0xfff0 actions=drop
cookie=0x0, duration=14320.076s, table=0, n_packets=117943152, n_bytes=6604754896, idle_age=342, priority=0 actions=NORMAL
pmd thread numa_id 0 core_id 0:
emc hits:0
megaflow hits:13107736
avg. subtable lookups per hit:2.47
miss:205
lost:0
polling cycles:839604875890 (91.50%)
processing cycles:77960165781 (8.50%)
avg cycles per packet: 20171.47 (917565041671/45488269)
avg processing cycles per packet: 1713.85 (77960165781/45488269)
Drop on IP and port with same priority rule
NXST_FLOW reply (xid=0x4):
cookie=0x0, duration=13172.593s, table=0, n_packets=23376, n_bytes=1355808, idle_age=734, priority=65535,tcp,tp_dst=0x50/0xfff0 actions=drop
cookie=0x0, duration=13132.160s, table=0, n_packets=0, n_bytes=0, idle_age=13132, priority=65535,tcp,nw_dst=7.7.7.104,tp_dst=0x58/0xfff8 actions=drop
cookie=0x0, duration=13531.996s, table=0, n_packets=104838715, n_bytes=5870913438, idle_age=734, priority=0 actions=NORMAL
pmd thread numa_id 0 core_id 0:
emc hits:0
megaflow hits:13107488
avg. subtable lookups per hit:2.40
miss:202
lost:0
polling cycles:1040592199369 (92.92%)
processing cycles:79341061547 (7.08%)
avg cycles per packet: 25109.17 (1119933260916/44602553)
avg processing cycles per packet: 1778.85 (79341061547/44602553)
Observation:
No observable difference in number of flows, when flow rule with same/varying priority is subset of another rule
Overlapping negative rule with priority
Higher priority rule which allow packets on a port , over a subset of range of ports to drop
NXST_FLOW reply (xid=0x4):
cookie=0x0, duration=485.046s, table=0, n_packets=1, n_bytes=58, idle_age=405, priority=65535,tcp,nw_dst=7.7.7.104,tp_dst=90 actions=output:2
cookie=0x0, duration=460.826s, table=0, n_packets=294, n_bytes=17052, idle_age=345, priority=65533,tcp,tp_dst=90 actions=drop
cookie=0x0, duration=22605.741s, table=0, n_packets=66186128, n_bytes=3706393004, idle_age=337, priority=0 actions=NORMAL
pmd thread numa_id 0 core_id 0:
emc hits:0
megaflow hits:13107651
avg. subtable lookups per hit:2.62
miss:241
lost:0
polling cycles:793656888377 (91.15%)
processing cycles:77049701271 (8.85%)
avg cycles per packet: 18327.99 (870706589648/47506933)
avg processing cycles per packet: 1621.86 (77049701271/47506933)
Higher priority rule which allow packets on multiple ports , over a subset of range of ports to drop
NXST_FLOW reply (xid=0x4):
cookie=0x0, duration=1195.522s, table=0, n_packets=2, n_bytes=116, idle_age=273, priority=65535,tcp,nw_dst=7.7.7.104,tp_dst=90 actions=output:2
cookie=0x0, duration=1171.302s, table=0, n_packets=558, n_bytes=32364, idle_age=214, priority=65533,tcp,tp_dst=90 actions=drop
cookie=0x0, duration=298.201s, table=0, n_packets=266, n_bytes=15428, idle_age=210, priority=65533,tcp,tp_dst=91 actions=drop
cookie=0x0, duration=23316.217s, table=0, n_packets=79293342, n_bytes=4440391844, idle_age=202, priority=0 actions=NORMAL
pmd thread numa_id 0 core_id 0:
emc hits:0
megaflow hits:13107492
avg. subtable lookups per hit:2.66
miss:253
lost:0
polling cycles:510428258044 (86.65%)
processing cycles:78637881424 (13.35%)
avg cycles per packet: 12268.58 (589066139468/48014208)
avg processing cycles per packet: 1637.80 (78637881424/48014208)
Observation:
Observable increase in number of flows in the presence of a rule with different action on port.
Overall observation based on the above flow rules:
In the presence of high number of flows rules (example: rules with match on port) even with same action, mega flow would end up performing as EMC, since OVS does not aggregate the individual flow rules.
Links:
Trex setup:
build-your-own-dpdk-traffic-generator
Multi queue:
configure-vhost-user-multiqueue-for-ovs-with-dpdk
Intel dpdk vswitch performance:
intel_dpdk_vswitch_performance_figures_0.10.0_0.pdf
